

Technical Monitoring – System, Process, Interface, and Connection
Technical Monitoringexists to best monitor and report on the successful (running) and unsuccessful (down) systems in your SAP environment. At CoreALM, we consider this to be an incredible asset to your organization, especially considering large projects, like S/4 HANA, that are approaching. In this blog, we will briefly explore Technical Monitoring from a System Overview, Process Integration, along with Interface and Connection Monitoring.
System overview
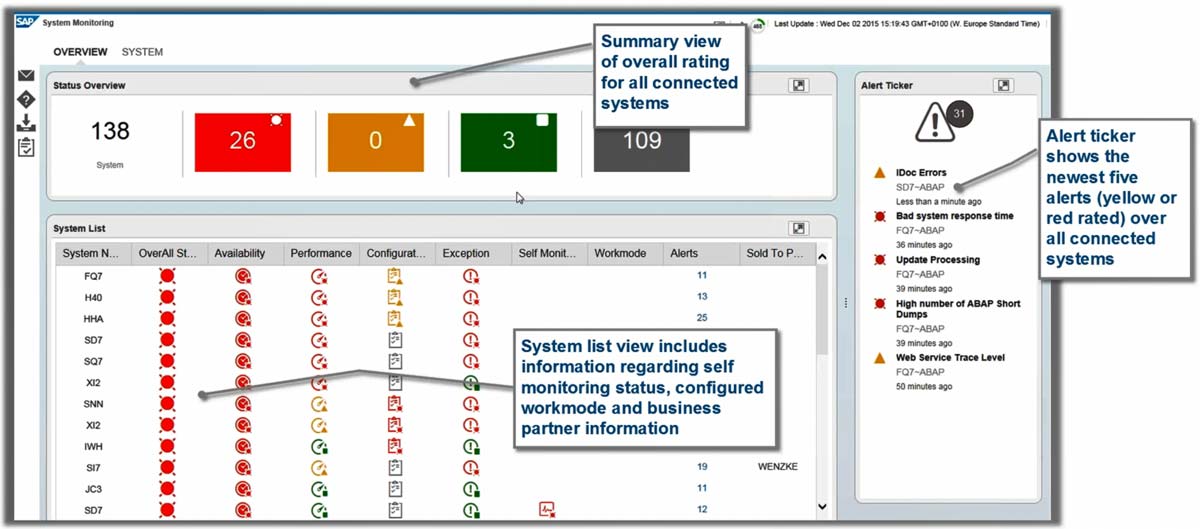
When we are looking at technical monitoring application, the overview is the main landing page. Across the top, you will find a quick summary of your environment. In this example, there are a total of 138 systems where at least 26 have RED ALERTS, 0 with warnings, 3 with errors, and 109 with no recordings (shown below). Over on the right, you will find the alert ticker, which is a combines all the tickets that provide the 5 most recent tickets. You can also see the different categories here too. On the lower half, you can find the System I.D. and Overall state; performance, configurations, exceptions and more can be configured in terms of works mode and maintenance windows. This view can also help to calculate SLA’s and won’t count against availability because certain outages were scheduled.
System Monitoring - Overview
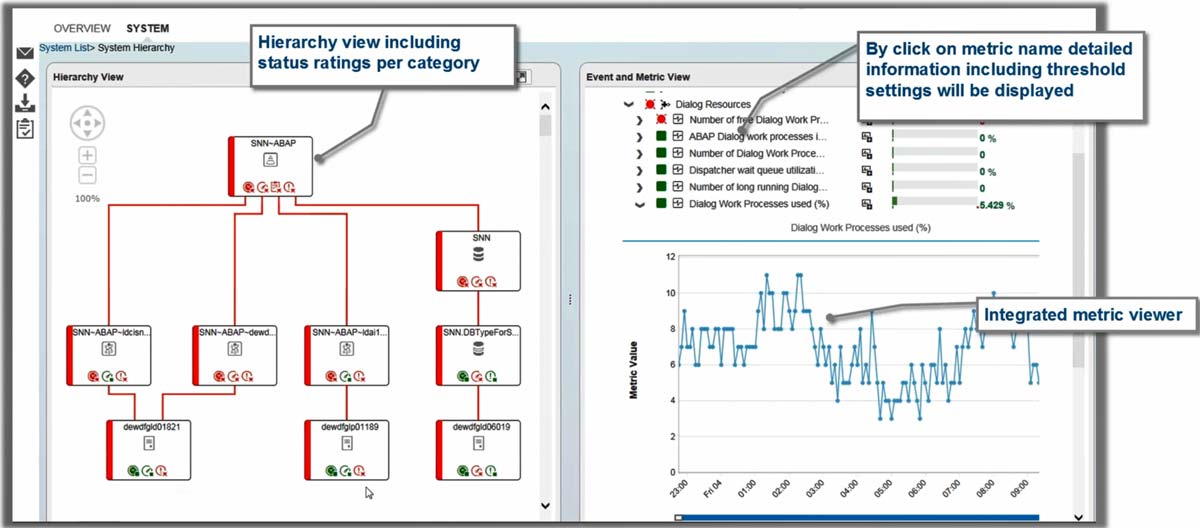
This monitoring dashboard also allows a Hierarchal View into the system. Starting at the bottom, shows the host that the application is running on, whether be an applications, a server, central instance off primary app server, database… all will be listed at the bottom. Overall, we can see the system as a whole and all of its building blocks. A portion that is not shown but worth mentioning is the Event and Metric View Window, which will give you the opportunity to drill in and see what the data is for that specific metric at that given point in time. If you decide to dig in far enough, you can also see the graphical presentation and a historical view of the metrics gathered over time.
Process Integration Monitoring
The Process Integration monitoring tool will really help to monitor the PI/PO system, which depends on many things, like the SLD availability. It will also look at certain components that makeup the PO: Are they running? It looks at the communication channels, messages that flows through the system, and visibility into generating alerts in case something goes wrong. The same is also true if you get an alert, you can route the alert to different groups. For instance, you can designate the PI/PO team receive PI related metrics only, if they are interface related. This tools allows for incredible flexibility.
Hierarchy and Metric View
Out of the box system checks of the minimum amount of components that are required to function as a legitimate PI/PO system. It does checks every so-often where you can choose the time frame to happen. It considers all the communication channels and identifies its configurations, letting you know if they are running or down. Within the interface, mostly everything suits user interactions that further digging to uncover the necessary metrics for Process Integration Monitoring.
Interface and Connection Monitoring
This is a little beyond the PI/PO, where it allows you to look at connection points. It lets you consider the connectivity between systems: like a web service connecting to a system. Everything can be monitored and brought in with several technologies, overall achieving transparent monitoring. This tool can build the connectivity lines that exist in your SAP and non-SAP landscape- automatically. It traces the connectivity from System A > System B, System B > System C. Then, you can get alerts at every connection point to know if anything fails. Below are some of the reporting capabilities, at least with the different view that gives access all into a single dashboard.
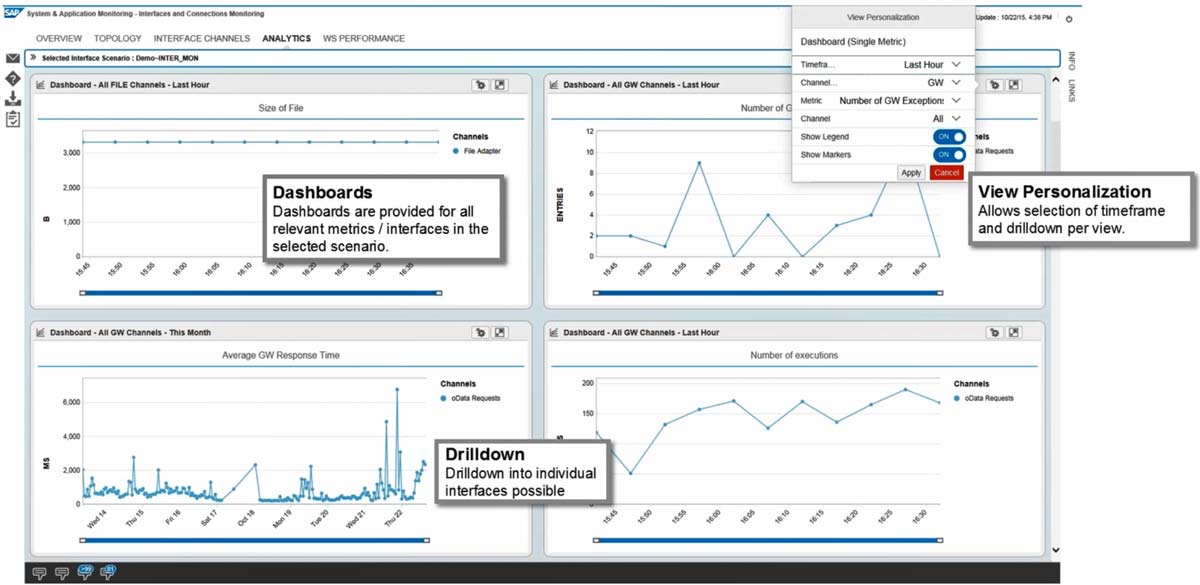
Reporting Dashboards
If you would like to learn more about Technical Monitoring, or SAP Monitoring in general, let us know!If you are looking into Business Process monitoring instead, then refer to our other blogs covering an array of Solution Manager, Focused Build, and Agile tools.

Did You Know? Modern Tools Don’t Equal Modern Governance
Many organizations replacing Solution Manager focus on adopting new tools rather than redesigning governance. While…
Did You Know? Control Didn’t Happen by Accident
SAP Solution Manager didn’t just document SAP changes it actively enforced governance. Through ChaRM, it…